Making better decisions on data is only possible when there is a deep understanding of data present and the events responsible for the generation of that data.
Data visualization via charts, graphs, and maps, helps us in understanding the complex form of the data in a simple and better manner.
Grafana and Prometheus, both help us in tackling issues related to complex data in a simplified manner.
Grafana is an open-source visualization software, which helps the users to understand the complex data with the help of data metrics.
It equips the users with features like alert systems, sharing of the dashboard.
It also helps users in studying time-series analytics.
Prometheus is an open-source event monitoring and alerting tool.
It stores the majority of the data locally after scrapping metrics, and after that, to generate alerts, it runs rules over data.
It came into existence because of the need for monitoring multiple microservices running within the systems.
It was initially built at SoundCloud.
Grafana vs. Prometheus: Which is More Popular?
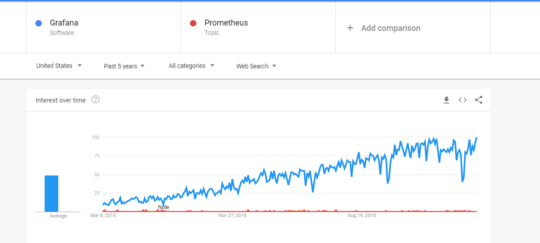
Both Grafana and Prometheus resolve the issues related to data. Let’s evaluate them on key parameters.
Grafana vs. Prometheus: Comparison Across Various Feature
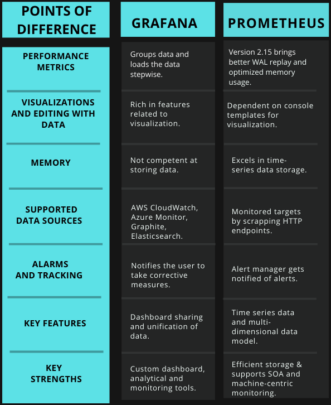
Grafana’s performance can be measured by the following parameters
- Grouping: Only the necessary data is presented according to your screen resolution and panel size of graphs.
- Using stepwise loading: To reduce the slowdown while graphs load, the important graphs need to be given priority, and other graphs need to be collapsed.
Prometheus, in its latest version 2.15 of CNCF, has brought many changes in regards to its performance. These include:
- Optimization of memory usage and data bytes and bits commonly called as blocks
- Improved WAL replay.
- Compaction no longer stores symbols and postings in memory thereby boosting performance.
Grafana being an open-source data visualization tool is rich in features related to visualization of time-series metrics. Also, it provides its users with additional options like plugins to help them visualize their data.
Prometheus, on the other hand, has to be dependent on console templates for visualization. It can graph data but has to be dependent on Grafana for full frameworks like queries and dashboards.
Also Read: Kibana vs. Grafana: Comparison of the Two Data Visualization Tools
Visualizations are dependent on data itself. But the same information needs to be stored properly to get the best out of it.
Grafana is only a visualization tool. It is not competent at handling data storage.
Prometheus takes an edge over here. It excels in time-series data storage and organizes them with essential value tagging.
Grafana supports the following data sources:
- AWS CloudWatch
- Azure Monitor
- Elasticsearch
- Google Stackdriver
- Graphite
- InfluxDB
In Prometheus, data metrics are collected from monitored targets by scrapping HTTP endpoints.
However, the way it collects data from sources exposes its data in the same way. Thus it has the efficiency of monitoring its own status.
Prometheus can do both the data collection and visualization of the same.
Within Grafana user has the option of configuring time for evaluation of alert rules.
Users get the notification here as to what changes are to be done for the triggered alert.
The alert system in Prometheus is mainly executed in two parts. The alerting rules forward the alerts to alert managers.
Alert managers then manage those alerts, including sending notifications via emails or other platforms.
Key features of Grafana include:
- Alert systems.
- Unifies your data.
- Dashboard sharing.
Prometheus excels in features like:
- Provides time series data.
- Flexible query language, PromQL allows users to select data in real-time.
- Multi-dimensional data model.
Following are the key strengths of Grafana:
- Analytics and monitoring tool.
- Visualizing system CPU, memory, I/O utilization metrics.
- Creating custom dashboards.
- Integration with tools like Prometheus, Graphite, InfluxDB, MySQL.
Below mentioned are the key strengths for Prometheus:
- Supports machine-centric and service-oriented architecture monitoring.
- Availability of viewing statistics of a system.
- Efficient storage.
Breaking down complex data in an understandable manner will be the first choice for any organization.
Grafana, unlike Prometheus, provides maximum options of breaking down data into an understandable form.
With its feature of supporting multiple databases, it helps in creating a much better understanding of data.
Prometheus specializes in event monitoring and has very little to do with the visualization part. Even it has to be dependent on Grafana for better optimization of data.
With the above discussion, it becomes quite evident that Grafana would be a better option to opt for when it comes to doing complete justice with data.