
A picture is worth a thousand words. With an abundance of data being available, it becomes that much more important to understand the data better for accurate results.
Open-source data visualization tools provide an easy and interactive platform even for the beginners. It helps minimize their manual efforts in analyzing and easy viewing of the available data.
More importantly, they come with easy customization options.
Users here get the option of viewing the complexity of their data into graph, chart or any other visually appealing form.
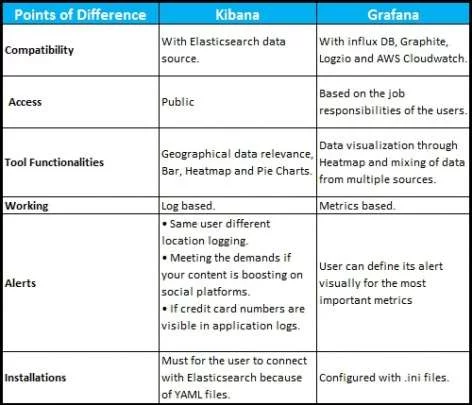
Accessibility to Kibana’s dashboard is totally dependent on the privileges assigned. These privileges are classified into two:
- Base Privileges: Wherein a user can access all the features in the dashboard. This accessibility can be read & write functionality or might be restricted to read functionality only.
- Feature Privileges: It again works on the same lines of reading and writing accessibility. The only thing here is that you might be able to work on a specific set of features.
In the case of Grafana, user permission is determined by:
- What position does a user hold in the organization.
- Accessibility permission granted to individual teams.
- Permission granted to access specific folders/dashboards.
- Admin access which helps administer accessibility rights of all the employees.
Kibana with its perceptive usability, is of prominent help at following things:
- Its time visual builder combines multiple timelines into one. And still it conveys across meaningful data representation.
- Provides the geographical relevance of the data.
- Data can be represented through a variety of visual representations like line, bar, heatmap, pie charts etc.
When it comes to Grafana, below mentioned are some of the key functionalities:
- Visualization of data via heatmaps and histograms.
- Visual representations for whenever it observes any abnormality.
- Adequately mixes up data from different source and presents them as one.
Kibana basically analyzes the logs collected because of servers and virtual machines' operations. All this function is boosted by Log app in Kibana wherein the display of results is customizable.
Grafana, on the other hand, is capable of analyzing and visualizing the data from the metrics. To quickly navigate the metric space, Grafana is dependent on the Graphite quick editor.
Kibana alert systems are its first-class entities and work on the following possibilities which lead to alert:
- Same user but different location logging.
- Content going viral on social media.
- If credit card numbers are visible in application logs.
Users have the privilege of managing the alert system within a single user interface. Also, they can analyze from the alert history about the actions taken for a particular alert.
In Grafana a user can define its alert visually, for the most important metrics. It also gives the option to the users as to how often the alert system needs to be evaluated.
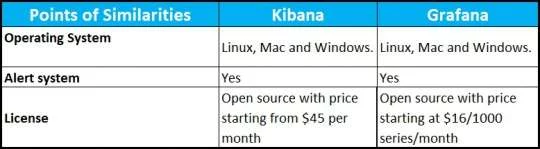
While installing Kibana it is a must for users to connect with Elasticsearch. The main reason behind this is YAML files whose syntaxes are touch-sensitive.
Grafana is configured with .ini files which are relatively easier but a user can override its configuration using environmental variables.
Also Read: Top 10 Alternatives to Kibana
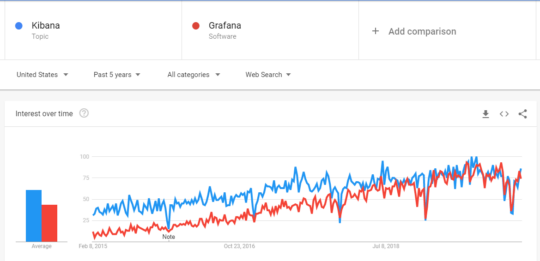 As per Google Trends, of late both the tools stand pretty much neck-to-neck in terms of their popularity.
Both Kibana and Grafana are open-source data visualization tools. Kibana and Grafana provide an in-depth understanding of log-based and metrics-based data.
Whereas Tableau holds expertise in business intelligence and has various secondary products which help with data analysis functionality.
Particularly in the case of Kibana and Tableau comparison, it is noticed that the later can connect to any data source. But with Kibana, one needs to migrate the data into Elasticsearch first.
Conclusion
Based on the above differences and similarities, both seem to be an apt choice for data visualization analysis.
It eventually boils down to your specific business requirements and the price that you're willing to pay.
Recommended For You:


