
If you are a web developer or someone who loves experimenting with website performance, you have probably heard of Google’s Web Vitals Extension. It is a useful tool to check how user-friendly and quick a website is. Recently, Google has decided to retire the extension. It has not completely vanished; rather, it is getting an upgrade by being included in Chrome Developer Tools or DevTools. Let's explore what this entails for you and why it is really good news!
What Was the Web Vitals Extension?
Before we discuss the change, let's briefly recall what the Web Vitals Extension did. It was a handy tool that helped developers in the measurement of Core Web Vitals—metrics such as Largest Contentful Paint (LCP), First Input Delay (FID), and Cumulative Layout Shift (CLS). These metrics are extremely important as they inform you about how fast your website is loading, how fast it will respond to your user interactions, and how smoothly it will load.
The extension was quite simple to use. You would simply install it and launch it while visiting a website, and it would provide you with an instant update on how the site was doing. But then Google decided to simplify things further by shifting these features right into Chrome DevTools.
Why the Change?
You may ask, "Why try to fix something that isn't broken?" Google's mission is to simplify developers’ lives. You no longer have to toggle back and forth among several tools; now, everything you need is at your fingertips—Chrome DevTools.
Here's why this makes sense:
-
- Fewer Tools, Less Hassle: No more installing additional extensions or tab toggling. Everything is now part of Developer Tools.
-
- Seamless Integration: Because Developer Tools is already the first-choice tool among developers, integrating Web Vitals metrics here makes the process more seamless.
-
- Improved Accuracy: With integration directly into Developer Tools, the metrics are better and simpler to analyze.
What is New in DevTools?
So, what does this integration have to offer? Break it down here:
-
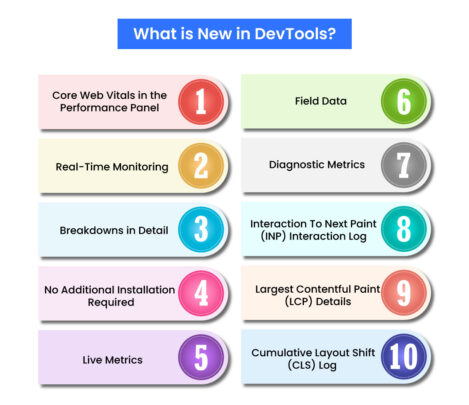
- Core Web Vitals in the Performance Panel: The Performance panel in Developer Tools now contains Core Web Vitals metrics. That is, you can view LCP, FID, and CLS data in addition to other performance data. It is as if you have all your website health statistics on a single dashboard.
- Real-Time Monitoring: With the Web Vitals Extension, you would have to check metrics manually. Now, DevTools offers real-time monitoring. You can observe how your site performs while making changes, which is a big time-saver.
- Breakdowns in Detail: Developer Tools doesn't simply display the numbers; it interprets them. You will receive breakdowns in detail of what is slowing your site down, such as slow images or JavaScript problems.
- No Additional Installation Required: Since the features are integrated into DevTools, you don't have to install or update an additional extension. It is all ready to go.
- Live Metrics: Your local test Real-time Core Web Vitals metrics.
- Field Data: Compare your local metrics with CrUX data for URLs and origins, both desktop and mobile views.
- Diagnostic Metrics: TTFB and First Contentful Paint (FCP).
- Interaction To Next Paint (INP) Interaction Log: Log interactions that contribute to INP with fine-grained timing for input delay, processing, and presentation.
- Largest Contentful Paint (LCP) Details: Discover the exact element causing your LCP score, view phase breakdowns such as Time to First Byte (TTFB) and render delay.
- Cumulative Layout Shift (CLS) Log: View grouped layout shifts that contribute to your CLS score.
Developer Tools not only displays performance metrics but also provides detailed breakdowns of what might be slowing down a site, such as slow images or JavaScript issues.
How to Access Web Vitals in Developer Tools?
If you are eager to give this a go, here's how you can view Web Vitals in DevTools:
-
- Open up Chrome and navigate to the site you would like to examine.
-
- Right-click on the page anywhere and choose Inspect (or use Ctrl+Shift+I on Windows or Cmd+Option+I on Mac).
-
- Navigate to the Performance tab.
-
- Begin recording by clicking the Record button (it's a circle).
-
- Engage with the page or reload it to record data.
-
- When the recording ends, you will notice Core Web Vitals metrics in addition to other performance metrics.
That's it!
What Does This Mean for Developers?
Developers are winners with this change. Here's why:
-
- Easier Debugging: With all that you need in one location, you can diagnose and resolve performance problems faster.
-
- Enhanced Workflow: Say goodbye to toggling between tools. DevTools is now your go-to source for performance analysis.
-
- Improved User Experience: By making it simpler to measure and optimize Core Web Vitals, you can build faster, more user-friendly sites.
A Bittersweet Goodbye to Web Vitals Extension
While it is always a little sad to say goodbye to a tool we have grown used to, this change is definitely for the better. The Web Vitals Extension served us well, but its integration into Developer Tools is a step forward. It is like upgrading from a flip phone to a smartphone and everything just works better.
A Smart Move for Developers!
Google's choice to sunset the Web Vitals Extension and bring its functionality into DevTools is a good call. It makes measuring and optimizing site performance a snap and makes life better for developers. So, if you haven't already, go ahead and fire up Developer Tools and check out the new features. You could very well fall in love with the streamlined experience.
What do you think about this change? Are you looking forward to trying it out, or will you miss the old extension?
For more such informative blogs, visit WisdomPLexus!
FAQs
1. What are web vital extensions?
Ans: These are tools that help measure how well a website performs, focusing on user experiences like loading speed and interactivity. They give insights to improve site performance.
2. What are DevTools?
Ans: Developer Tools are built-in browser tools that let developers test, debug, and improve websites. They help inspect code, fix errors, and see how a site works in real time.
Recommended For You:
What is the Google Speed Update? How will it affect Page ranking?


