
An abundance of data is present within the organizations but making the best out of it remains a challenge. Data visualization has helped to reduce this issue to a great extent.
Data visualization tools, with their competitive features, have brought a great deal of advancement in the data industry.
Kibana and Tableau are few of the popular tools that have helped in solving the issue of understanding the complex data in a much more detailed manner.
Kibana helps in the analysis of data and representing the same analysis in the form of visualization.
Features like interactive charts, anomaly detection, and secure sharing, helps users to interact with the data in a much more professional manner.
Tableau, is compatible universally, which means that unlike Kibana it needs not to be dependent on other platforms for connecting with data.
Moreover, customization and deploying compared to any other tools can be done effortlessly here.
Kibana vs Tableau: Which is More Popular?
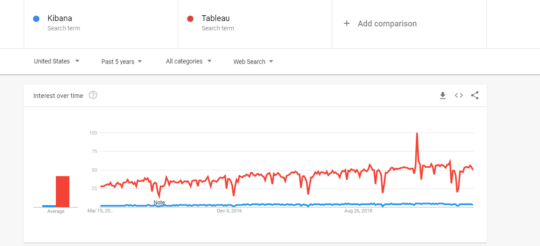
From the above, it can be evaluated that Tableau is stepping ahead in comparison to Kibana in terms of customer preferences.
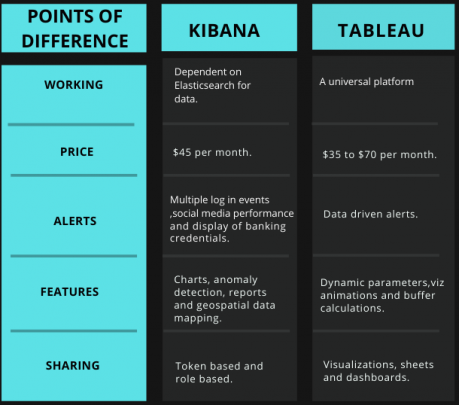
Kibana vs. Tableau: Difference Across 5 Features
Kibana is an open-source and visualization tool that is dependent on the Elasticsearch for the data, which are stored as indexes within it.
For interacting with the data, Kibana has to interact with the information that gets stored as indices in Elasticsearch.
Kibana is merely a visualization tool meaning that the data has to be fed to it so that the same can be explained in visual patterns.
For this Elasticsearch is used wherein interaction happens between the data stored as indices and kibana.
Tableau has the ability to extract the data from any platform. This data is directly moved towards the data engine of Tableau.
Data analyst works here on the data and presents the same in pictorial forms. The data after the analysis is presented to users in statistic forms.
Also Read: Top 10 Alternatives to Kibana
Kibana, on its own, is free to use.
However, to take the best from the Kibana, one has to combine it with Elasticsearch. It offers its services in Elastic Cloud starting at the price of $45.00/month.
Tableau has unveiled their latest prices as under:
- Tableau Desktop Personal – $35 per month.
- Tableau Desktop Professional – $70 per month.
- Tableau Server – $35 per month.
- Tableau Online – $42 per month.
Alerts in the Kibana happens under the following conditions:
- Multiple log in events – Same person logging in from multiple places.
- Social media performance – If the demands for trending products are not being met.
- Display of banking credentials – If credit card numbers are visible within the logs.
Also, Kibana allows its users to get notified on email, PagerDuty, Slack, and HipChat.
However, in Tableau, data-driven alerts automatically send alerts to key people specified for that alert.
For Tableau online, live data sources are evaluated after every 60 minutes.
Users have the option of even adding themselves to the alerts created by others.
Site administrators can easily enable or disable the alerts and even make the changes to it accordingly.
Listed below are some of the key features in Kibana:
- Interactive charts.
- Detection of irregularity in data.
- Multiple search options like field-level search, logical statement, free text searches, and proximity searches.
- Geospatial data mapping.
- Reports.
Following are the key features that Tableau has to offer:
- Dynamic Parameters – Forget about the regular updates in parameters. Set it once and Tableau will update it automatically.
- Viz animations – Helps users to understand the changes in the data.
- Buffer calculations – Users can understand the data on parameters like location, distance, and measurement units.
- Multiple data source connections – Extract the data from multiple data platforms.
- Mobile-friendliness – Users would be able to view visualizations in their mobile phones as well.
Tokens are needed to share the data in Kibana.
Not only this, but the role-based sharing is also provided in Kibana.
The main motive behind this is to restrict any information to a particular set of members only.
In tableau, users can, however, share the data in the form of visualizations, sheets, and dashboards.
Users can share data from various sources like on-premises or on any cloud network.
Yes, Tableau can be connected with Elasticsearch for visualizing the data. Since Tableau can be connected to any data source, Elasticsearch is no exception and can easily be added with Tableau for visualization purposes.
Reports can be generated with the help of the Tableau for Elasticsearch data.
Once Elasticsearch is added as a data source, the data then needs to be mapped to the Tableau.
Tableau now would be able to analyze the data and also will provide the option of visualizing the same.